You name it, we can do it!

Family at the restaurant

By – Megan Clarke, Client Account Manager.


Mystery shopping can offer an endless range of unimaginable insights.  So, before you come to the conclusion that mystery shopping provides limited information, let’s take a look at some of the more unique projects we have carried out.

Aside from the more regular convenience store visits, hotel stays and finance calls, we have an array of past projects that we are sure will intrigue you.

We have sent the underaged demographic to shops to buy cigarettes to see if staff are checking for ID and we have sent people to funeral homes pretending they have had a bereavement to assess the empathy of staff.   Some have been sent to visit the cliffs, some have made video consultations with the doctor for the contraceptive pill, cold/flu and back pain.   We have assessed photo machines in shopping centres, assessed charity collectors on the street and even travelled on the ferry to price the products on the boat.   To make things even MORE exciting, we have challenged people to the adventure rooms and got them to break the rules, sent them on thrilling theme park rides and sightseeing adventures across land and sea.

Not only can the scenarios be wonderfully weird but the profile of the lucky individual undertaking the assessment can be requested and we will make it our mission to meet the specifics.  We have sent ladies with a bigger bust to lingerie stores to try on bras and to get seriously specific, we have used a shopper over 50 with a stigmatism in one eye, no history of heart disease and a prescription more than plus 5 on their lens to test an optician.

We are always willing to take on new challenges, things we have never done before in an aim to provide our clients with the essential information they need to grow and strive.

Need more information? Click HERE

Banking For Yourself:

banking, self service banking, customers

Your Customers and Self-Service Banking.

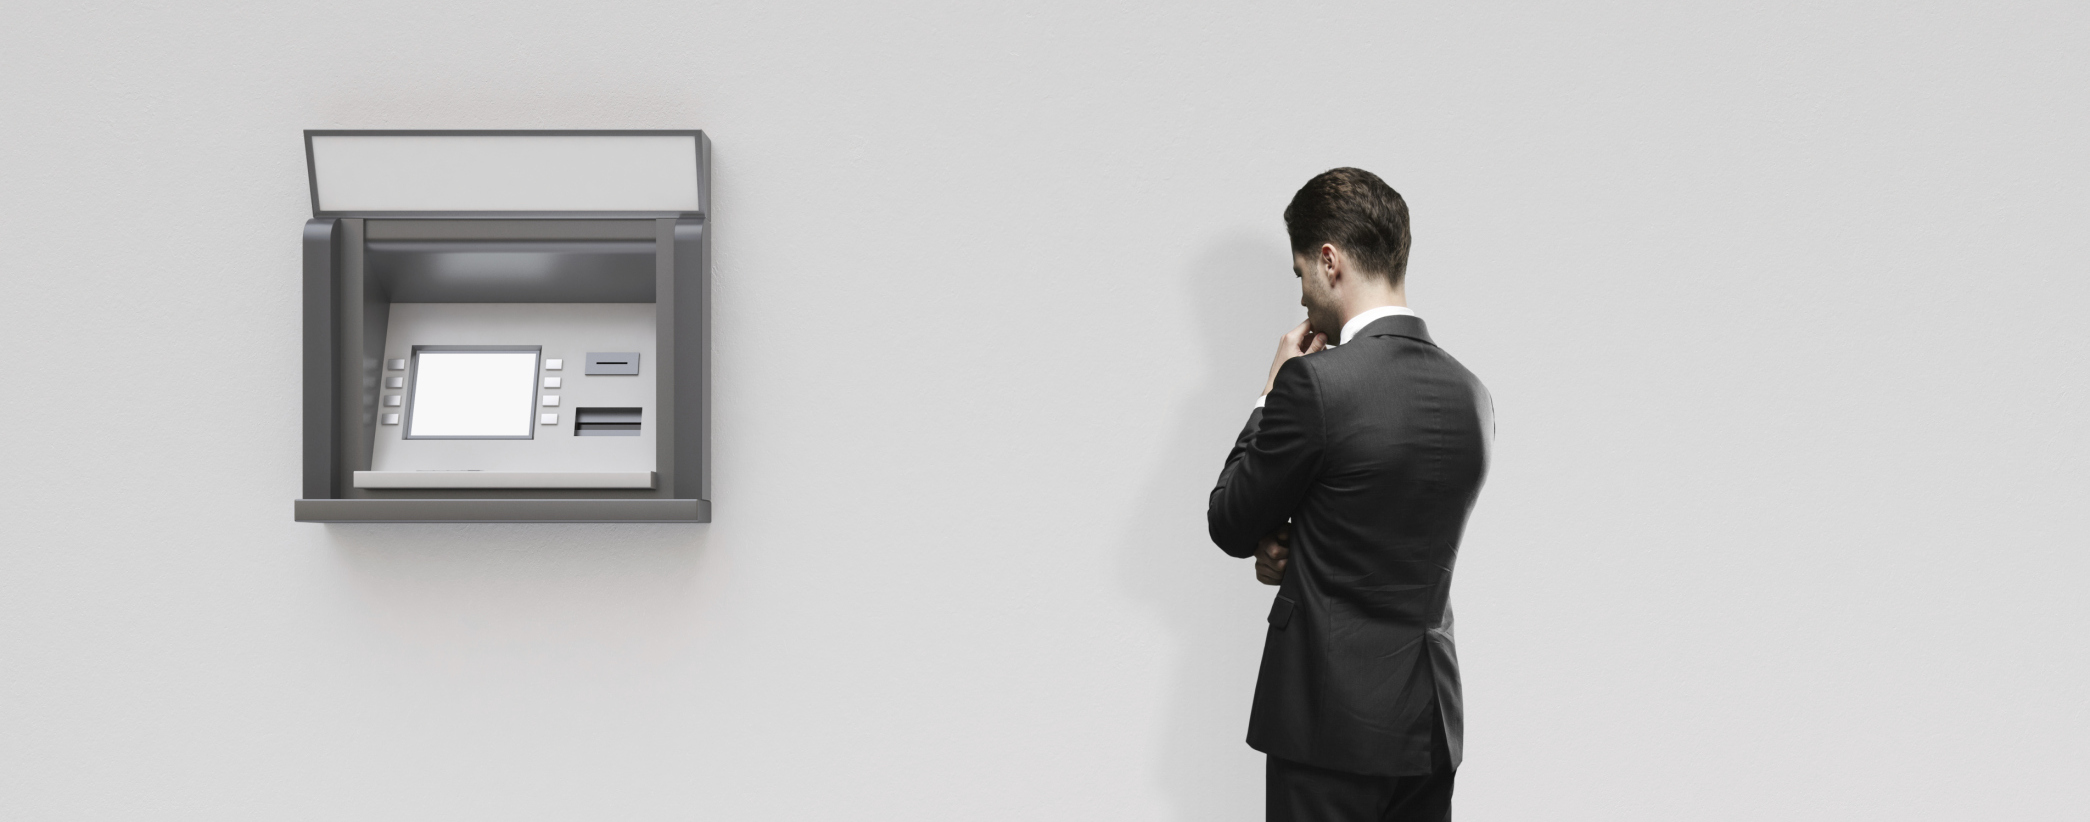
In recent years, as we all know, banks have been in the headlines more than they would have liked. One of the reasons they’ve been subject to so much public discontent (not necessarily the main one, obviously, but one that does exercise people) is the issue of local branch closure. The closing of local bank branches around the country is obviously more symptomatic of a deeper problem than a problem in itself, but it is a symptom that can potentially affect customers in a very real and concrete way in their day to day lives (certainly it exercises people – for example see here and more recently here). So, because it’s our business, we’ve asked bank customers some questions about the relative importance of local branch services and self-service banking. Here’s what we discovered.

We asked a wide range of people across several age profiles about what services were important to them with regards to their banking. The largest age profile that responded to our survey was 19-25 years of age (they constituted over 67% of respondents). The first question we asked was the broadest (and probably the simplest): “Would you like if your bank had a retail presence nearby?” 71.65% of respondents in this profile answered a simple “yes”. In terms of what services were most important to this group, while 90.19% of these respondents advised that a point of contact for advice and support was either very important or somewhat important, an ATM (99.4% classifying it very or somewhat important) and Self Service Banking Machine (96.8%) were overwhelmingly the most important aspects of banking to which they wanted access. 90% told us they would be likely to use a local branch of their own bank if it was open in their area, however only 2.75% advised that they would be very likely to move bank to a bank which had a local branch. 46.67% claimed they would consider such a move, but 50.59% admitted they would not be likely to move bank for that reason.

At the other end of the spectrum, in the age range “61 and over”, 85.71% of respondents in this group told us they’d like if their bank had a retail presence nearby. 81.82% of these respondents advised that they wanted this as a point of contact for advice and support, but 90.91% advised the most important single service they required was access to an ATM. 86.37% advised a cashier/teller was either very or somewhat important to them, but 72.73% also advised that visible information on products and services was an important aspect of the services local branches provided. Perhaps unsurprisingly, the importance of self service banking machines was significantly lower among this age profile, but again, 72.73% regarded it as very important. 81.82% of respondents advised that if their bank had a local branch they would certainly use it, but only 6.67% of respondents told us they would certainly move banks for that reason (with 60% exactly saying they would not be likely to move bank for that reason).

In terms of gender breakdown, 43.28% of respondents were male, 56.72 female, but the survey seemed not to reveal any major difference in focus between the genders. There were only a handful of responses where there was significant (5% or greater) difference in the answers of the respective genders. The use of a local bank branch as a point of contact for advice and support was more important to women (91.19% of women found it important, only 81.5% of men), while, perhaps paradoxically, though 96.28% of women felt self-service machines were important, only 90.45% of men felt this way. Finally, while 85.71% of men advised they would use a local branch of their bank if it were available to them, 92.86% of women felt they would use one. As for changing banks if one opened a local branch? Only 3.59% of men and 2.84% of women felt they would be likely to, with 52.69% of men and 50.71% of women both feeling they would not.

So, what does this tell us about banks and their relationship to their customers? Well, first of all, while age does play a factor in how customers use their banks, it’s not as profound a factor as you might suppose. While self service banking machines were more important to the younger cohorts, even in our oldest age range (61+), almost three quarters of people described them as important or very important, with 93.81% feeling that way overall). Across the age ranges, ATMs were overwhelmingly the most important service customers felt their banks should provide – overall 93.56% of respondents felt they were very important, a further 5.23% considering them somewhat important. This suggests a high level of comfort with self-service banking right across the age ranges of our survey. Also, while 72.44% of people would like it if their bank had a retail presence in their area, it seems as if this is a largely sentimental notion – 51.59% felt they would not be likely to change bank based on such a factor, only 3.17% feeling they would be likely to. Age seems not to be a significant factor here; while the middle age ranges have mortgages and the associated financial dealing which may make switching banks a pain, even our youngest and oldest age ranges admitted to a reluctance in switching banks.

As such, it seems that self-service electronic banking are the key services that banking customers consider important to them, despite a somewhat insubstantial sentiment to the contrary.

Loving Your Customers on Valentine’s Day

Valentines Customers

What Your Customers Want on Valentine’s.

For the hospitality and retail industries, February 14th – Valentine’s Day – is one of the most important single days of the year. Your restaurant should be crowded, flowers and chocolates should be marching out of your shop. But how should you maximise the business potential of this day? How can you ensure that you get the most possible benefit for your business and give the most appropriate, sought-for product or service to your customers? As with so many aspects of business, here at Customer Perceptions, we can help. We conducted a survey to capture the attitude of the general public towards the most romantic day of the year, and their spending intentions for it! Here’s some of the results.

First of all, of our respondents, 73.12% were female, just under 28% were men. The largest single age group to respond to our survey was the 41- 50 band (constituting just over 28% of our respondents), with only just over 1% (1.07%) being under 18 and no responses at all from anyone over 70. It seems, according to our data, that Valentine’s Day tends to be most important for people between the ages of 26 -60, with that cohort constituting 82.88% of all our respondents. Of that group, the overwhelming majority were in a relationship (83.44%), with 50.98% being married and 66.46% being in a relationship for 5 years or longer. This is the shape of your Valentine’s market, and these are the respondents the remainder of our statistics are drawn from.

In terms of what this group of our respondents felt would be their ideal Valentine’s Day, overwhelmingly (49.35%) felt a romantic getaway would be their favourite option, with the next most popular option, a romantic meal, being chosen less than half that often (19.48%). In terms of actual expectations however, respondents seem to be slightly less ambitious. When asked what they’d like to receive for Valentines, almost two-thirds (60.78%) wanted a simple card, with 36.6% (the next most popular option) choosing dinner. The most obvious reason for the gap between the ideal Valentine’s Day and the practical reality was money – the most common budgeted spend for Valentine’s Day among our respondents was €20-€50 (28.57%), however the next most common budgeted spend was €50-€100 (22.08%), which is a reasonable amount of spending power into which your business can tap. Price wasn’t the only factor for most of our respondents, however. Given the age profile I’ve chosen to focus on it’s probably unsurprising that for several of the couples children was an issue – limiting the amount of social flexibility they have on the night, but for more still work played a role – several couples had at least one partner working on the night. It seems clear that for the people for whom Valentine’s Day is most important flexibility is a key issue – the actual night of the 14th of February may not be most convenient time for them to avail of particular Valentine’s services.

In terms of a gender divide, there were some interesting results. For women in our chosen field, 26.09% were planning a romantic night in, while 29.41% of men were. In terms of an ideal, a romantic getaway topped the poll for both men and women (48.7% of women and 51.28% of men). This was fairly consistent across both genders, but while 4.35% of women were actually planning a romantic getaway, 8.82% of men were. While this might immediately beg the question “who, exactly, are all these men going away with if not the women?” it might also suggest that getaways were being purchased by men without the knowledge of their partners. Indeed, the gender breakdown of budgeted spend seems to suggest a pattern – take a look at some of a breakdown of some of the budgeted spend statistics we collected:

Women Men
€10-€20 12.28% 2.5%
€20-€50 22.81% 45%
€50-€100 21.05% 25%


So, on Valentine’s day, and perhaps contrary to what the expected result might be, men are the big spenders. Whoever is driving the choice of purchase, it is the men who will actually spend more money on this holiday.

So, the key things to take away from the survey – Valentine’s Day is most important for couples in longer term relationships, aged broadly from 26 and up (with a severe drop off once they leave their 60s) but despite that broad age range, there’s real consistency in what these couples are looking for. They’re all effected by the same things – work and children mean they require flexibility and convenience, they’re predominantly very settled, so mortgages and (again) children mean they require real value for money, and the price point is important. And finally, and perhaps somewhat surprisingly, for your big sales you’ll be closing the deal with the men, ideally – they’re willing to spend more and to be somewhat more extravagant for the holiday.

Coffee Drinking in Coffee Shops

Coffee Shop, Coffee brands, customer perc blog post

Why Your Customers Do It, And What They Want More Of.

The Background

Coffee in Ireland is a drink growing in popularity year on year.

The Irish Coffee Council is the voice for the coffee industry in Ireland in matters of growth, manufacture, distribution and consumption of coffee, and while even they accept that “we still drink far less coffee than our European neighbours – and remain at heart a “tea drinking nation”” (here), it is unquestionably true that coffee has been (and continues to be) a consumer good growing more and more in popularity all the time – value sales of coffee grew by 12% in 2014 according to Euromonitor International, with fresh coffee sales accounting for that growth (instant coffee sales are, in fact, consistently declining).

Here at Customer Perceptions, it’s our business to take note of trends in retail and hospitality, so we asked people about their experience and attitudes to coffee shops. This is how they responded, and some conclusions we can draw from those responses.

The Numbers

The first question we asked was very simple – how often do you visit a coffee shop? The largest single group of respondents (56.25%) visited once a week. After that the next largest segments were “a few times a week” (12.5%) or “once every two weeks” (again, 12.5%). Perhaps surprisingly, when we asked our survey respondents whether they preferred sit-in or take-away, fully half of our respondents suggested they preferred to sit in, with only 12.5% preferring take-away coffee (although 37.5% admitted to having no preference either way, which suggests that at some points they are sitting in to drink their coffee). When asked if they prefer large chain coffee shops or small independent establishments, the overwhelming response (50%) responded that they preferred small independent coffee shops. Only 12.5% admitted to preferring large chains.

In a very direct way, it’s not just about the coffee for people. The overwhelmingly vast majority of our respondents do not simply purchase coffee alone – only 12.5% bought nothing else, with 75% of people buying a pastry, cake or bun, or 31.25% (with some overlap, obviously) buying a sandwich. In terms of an average spend, only 31.25% of respondents spent less than €5, with the remainder spending between €5 to €10 per visit. In terms of what people find important when they visit a coffee shop, cleanliness came out on top, with 81.25% of respondents rating it very important, the next closest factor in their choice of coffee shop being staff friendliness (50% rating it very important). Price, perhaps surprisingly, was rated very important by only 37.5%, but 62.5% did rate it quite important.

Another possibly surprising result is that child-friendliness was rated not important by 62.5% of respondents, with only 12.5% rating it very important (below even free wifi, which 18.75% felt was very important). Quality of the coffee itself is also key, given that 87.5% of respondents considered either a very important or quite important factor. So, what conclusions can we draw from these figures?

The Conclusions

Given the background of a the coffee market in Ireland (sales of coffee increasing overall while sales of instant coffee decline) it’s perhaps unsurprising that the quality of coffee has become so important a factor – people seem to be becoming coffee connoisseurs, or at least consider themselves knowledgeable about coffee (this is also reflected in our survey, in that while 68.75% of respondents consider quality of coffee very important, only 37.5% rated price as important).

People are willing to spend more for quality. However, the rise in consumer coffee sales also means that people are frequenting coffee shops for other reasons – proximity to home or work was rated “not that important” by 43.75%, with only 25% rating it “very important”. The comparative lack of importance of child friendliness and price tell the other half of this tale. Coffee shops (especially with sit-in business) is seen as a small luxury – an escape from the responsibilities of daily life (81.25% responded that atmosphere was important or very important).

This is key for any coffee retailer – a 2011 study by Bord Bia found that overwhelmingly people felt coffee was not a luxury item, and that good quality coffee was available from inexpensive discount retailers like Aldi and Lidl – it was part of their daily lives. Our own survey shows that coffee shops specifically are not part of that trend. Atmosphere is important, quality of coffee is important, having to travel to the establishment isn’t, nor is any coffee shop’s catering for families.

This is what coffee shops are competing on – not on producing a product that’s already been cheaply stocked up on in your customers’ own homes, but on a relaxing atmosphere, a quality product and a reprieve from those very homes, just for a little while.

Your Customers’ Moments of Truth- Guiding Them Through

Customer business

A customer’s “Moment of Truth” is the crucial moment at each step of their dealings with your organisation, so a customer might have several Moments of Truth before they enter your premises, make a purchase or decide to return again!

Have some of your managers, staff or even a few friends complete a quick Moments of Truth audit when they have a moment. You’ll need to adjust the specifics to your own business, but it should look something like this: 

Pre-Engagement                                                                                     Score 1 (low) – 10 (high)


  • Website/Brochure/Advertising/ Prospective Customer Communication
 
  • Telephone/ Email Enquiry Communication
 
  • Convenience of Location and Access (Parking, etc.)
 
  • Experience/ Perception/ Reputation/ Word of Mouth


Engagement                                                                                          Score 1 (low) – 10 (high)

  • Ambience & Atmosphere, Lighting, Colour, Décor, Music, Hygiene, etc.
 
  • Store Layout, Store Flow, Signage, Ease of Navigation
 
  • Staff Appearance, Uniforms, Personal Presentation, Name Badges, etc.
 
  • Staff Pleasantness, General Customer Service Disposition, Attitude
 
  • Customer Needs Investigation Skills, Product and Technical Knowledge
 
  • Selling Skills, Closing the Sale Skills
 
  • Ease of Payment and Exit


Post-Sale Engagement                                                                       Score 1 (low) – 10 (high)

  • “Purchases to Destination”, Delivery, Installation
 
  • Product and Process Instruction/ Ease of Use
 
  • Supports/ Help & Assistance
 
  • Warranty/ Guarantee


                There’s a long list of potential moments where your customers could be swayed one way or the other by a whole host of possible factors. The idea here is to get people – your managers, your staff – to think about when and where those moments may occur, and how best to address them – to make sure that the customer is swayed one way rather than the other.

Once your staff are in the habit of thinking in these terms then new Moments of Truth applicable to your own business will suggest themselves, and with proper engagement by your managers and staff (and a little bit of imagination), you’ll find concrete improvements in your business performance in every category!

Making Your Customers Comeback Kings!

boomerang customers comeback kings

Most businesses spend a lot of time trying to attract new customers. Advertising, promotions, social media – you’re probably doing it all. It’s necessary, of course, and no organisation should neglect trying to attract new customers who might be interested in doing business with them. Here’s what they might be missing, though, in the headlong rush to attract new customers.

Try this exercise:

  1. Calculate ALL the costs associated with attracting new customers every year (advertising, online, etc.)
  2. Divide that number by the number of new customers who engaged with you this year.
  3. This is your new customer acquisition cost.


Depending on how much (or little!) a new customer spends in doing business with you, you may actually LOSE money on doing business with some of your new customers!

There is a type of customer, however, that doesn’t incur these costs: a returning customer. Every returning customer starts as a first-time customer, obviously, but an exercise like this one helps to focus the mind on exactly why it’s so important to build a relationship with each and every one, and keep them coming back!

Consider this: we here at Customer Perceptions have reported on over 350,000 “consumer engagements” over the past 19 years of our existence: again and again, year after year, we are amazed at the vast investments made by the retail and service sector in premises, facilities, fitouts and furnishings, technology, stock and wages – all while ignoring the key factors that annoy customers and have them spend their money elsewhere, and that should be the key consideration. Remember, a returning customer isn’t arriving into your business with a negative euro amount hanging like a cloud over their heads!

The great Sam Walton probably said it best:

“There is only one boss and that is the customer… he can fire everybody in the company from the chairman on down, simply by spending his money somewhere else.”

A new customer is a great thing, folks, but a returning customer is better. Find out what they like. Find out what they don’t like. Find out what they want more of, and give it to ‘em!

Six Ways to WOW! Your Customers!

Wow Customers!

We’ve been talking to some of your potential customers, (because that’s our job!). We asked them to recount a time when they were wowed by a hospitality experience, and to explain exactly why – to identify the individual elements of the experience that contributed to them being blown away by an establishment. We called it the WOW! factor, and we’ve dissected the information we were given to try and understand exactly what a WOW! factor consists of, and to figure out how to build them every time! We got 93 responses to our query, and we broke them down based on their importance – how many people specifically mentioned each factor. Take a look at this information, it comes directly from hospitality customers, and it’s the anatomy of a WOW!

  1. Complimentary elements. Free stuff!

This might surprise you, but while it did inevitably merit a mention in the poll, it didn’t feature as anything like the most important factor. In fact it tied with our next category for least important. Customers certainly like it when they get something for nothing, but it’s really not a deciding factor for them. Also, while we had one respondent relate the extravagant story of hotel upgrades when the staff discovered her future-husband was proposing, for the most part people were mentioning things like loyalty cards that entitled them to a free coffee after so many purchases. Little things can go a long way, because ultimately this isn’t what most people are looking for. It’s a nice-to-have for customers, not a must-have.

  1. Facilities.

Tied for bottom in importance with complimentary elements was facilities. That should probably be a relief, since facilities can be expensive to change. Parking, for example, was mentioned once or twice, but can be something largely out of your hands – the space you have around your business isn’t something you can realistically change. What is within your power to change – and made up most of the comments about facilities, by the way – was cleanliness. With some staff diligence it’s simple to implement and it’s important to people, especially in the hospitality sector. Chances are, in this sector, people are coming to you for food. Seeing evidence of a real commitment to cleanliness puts your customers’ minds at ease.

  1. Price.

It might be surprising that out of 93 respondents, only 28 specifically mentioned price as a factor in their WOW! experience. Now, we’re not saying value for money isn’t important to people – after all, even in this poll almost a third of respondents mentioned price specifically, and that’s a significant percentage – but in terms of what blows customers away, it’s not as important as you might suspect. There’s also a distinction to be made about what factors initially draw a customer to your business – the WOW! factor is very much about drawing people back to your business a second time, and in a survey about trying out a new restaurant price might have featured more highly. BUT! With those provisos in place, and in terms of wowing customers, it seems like people are willing to pay for experiences they find to be exceptional, which should be encouraging!

  1. Atmosphere.

We’re getting into the more important factors now, with about a third of people citing atmosphere as a crucial factor in their food and beverage experience. Like facilities, this is an element that in certain ways it might be difficult or expensive to do anything about – a few of our respondents mentioned things like mountain and sea views or medieval castles – obviously difficult to organise if you’ve got a small town-centre café. What should be encouraging, though, is that for the most part, when they talked about this category, respondents mentioned a “welcoming” atmosphere. That’s something well within the reach of any establishment to achieve – a little attention and a polite, warm attitude from staff might save you having to find a castle to stick on the premises!

  1. Food and Beverage Quality.

This one almost goes without saying. It was the second most important factor for respondents to our poll. Food and drink is the lifeblood of the hospitality industry, it’s ultimately what gets your customers’ bums onto your seats, and it seems that it features heavily in terms of what wows a customer too, so take care and invest in it. There are some ancillary elements to food and bev that might be easy to overlook – presentation was important to people, but also staff knowledge about the menu – when a customer asks a question about an item, they shouldn’t be met with a blank stare. Ideally, they should be met with a confident understanding of the product.

  1. Staff/Service.

72 out of 93 respondents specifically mentioned this factor, making it the most-mentioned factor in creating a WOW! experience in our poll. More than three quarters of our respondents felt it was worth specifically mentioning, but if you read over the other factors, you’ll see how many of them rely in some measure on your staff. Certainly, it’s possible to argue that of the six factors we identified, four of them rest on staff behaviours and competencies (the cleanliness of your facilities, the welcoming atmosphere, etc.). It’s a striking reminder of just how valuable an asset your staff is, and should give pause for thought – how well-trained are your staff? Do they need more guidance in the performance of their duties? Answer these questions well, address the issues that they raise, and our poll suggests you’ll have spent your time and effort well.

Ultimately, as turns out, it’s people who WOW! people.

Still Blasting Customers Out of It

Customer Music

Customer Perceptions Ltd. have recently updated a survey they first conducted in 2008 and it suggests that over 70% of Piped, Background and Store Music serves to satisfy the taste of staff but is often disliked by customers.

Over 400 Customers and 200 Staff were surveyed in 70 outlets across the Island of Ireland in June. The outlets ranged from fast food outlets to middle class restaurants and top hotels, from fashion boutiques to department stores, auto accessories shops, mobile phone retailers, small and larger supermarkets and stationers & newsagents.

Customer Perceptions has experience of compiling some 340,000 “Mystery Shopping” reports for its clients over nearly 20 years but as Company Director, Emma Harte, explains; “We looked at this subject of in-store music about 8 years ago and we think it interesting that the findings have changed very little. The original idea of the survey started in our own canteen, most of our team agreeing that music in stores was often too loud or inappropriate for the target customer of the store in question”.

This year’s survey shows:

  • 86% of outlets staff selected the in-store music and its volume
  • 63% of cases, no formal policy exist regarding the background music selection
  • 88% of staff “liked the music played in their place of employment” (other than at Christmas time)

However

  • 58% of the customers surveyed said that they often find music levels much too loud
  • In-store music choices were disliked by 76% of the 45+ age group and 31% of the younger group
  • 59% of customers thought the music was “inappropriate for that specific store”
  • 28% of customers said that the piped music or radio was occasionally the cause of them leaving a store before they would otherwise do so or avoiding it altogether
  • 32% thought the music / radio in the background played “a significant role in the atmosphere and image created by the outlet”
  • 22% of customers said they never notice the music / radio one way or the other